5. Why the Institutional Tools Matter
Understanding What's Happening Beneath the Price
We've talked about owning companies, choosing protection, and managing positions through market declines.
What evidence helps you decide when to act?
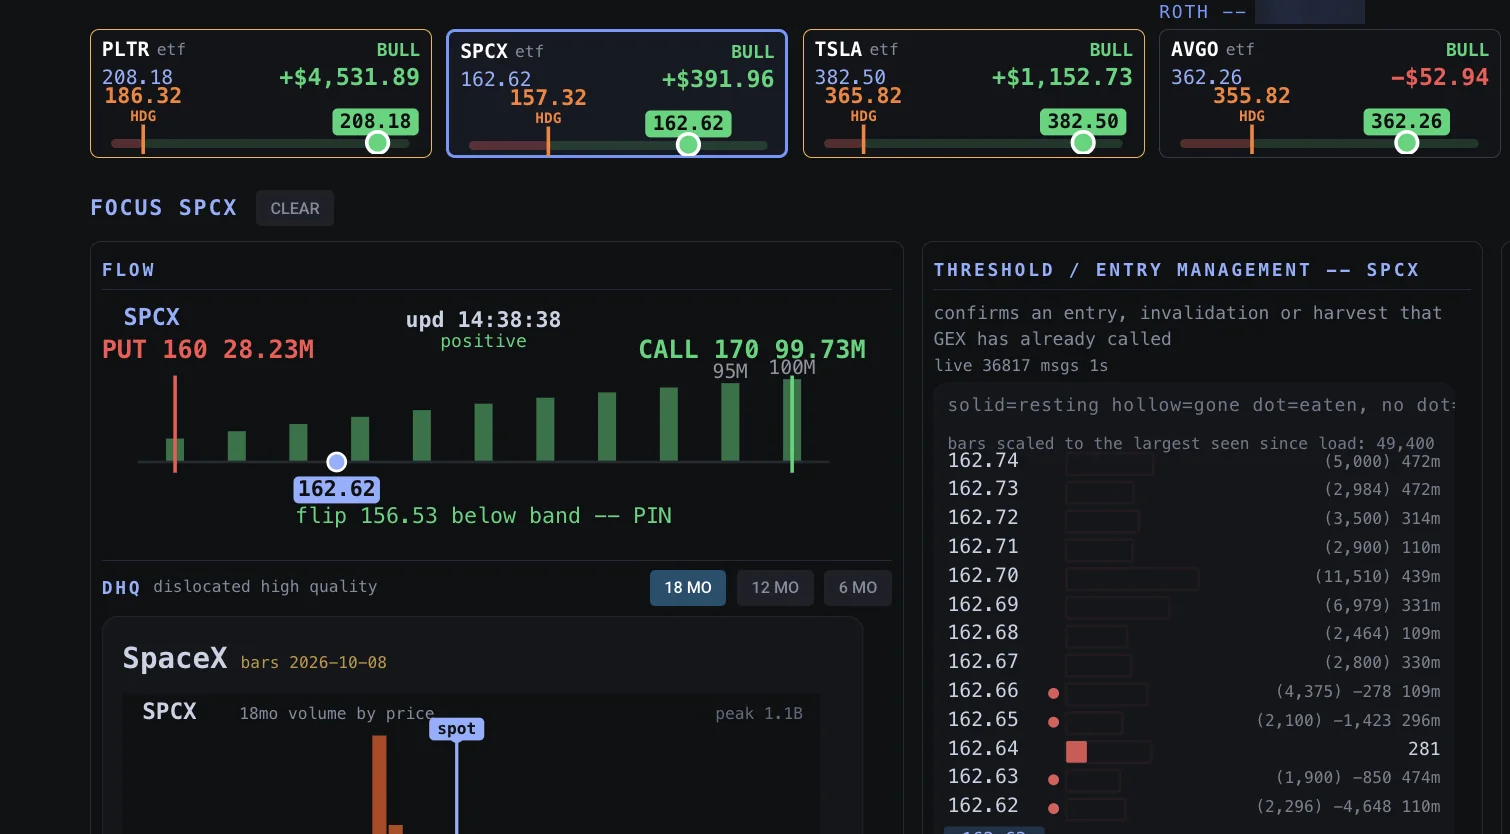
FlowDM's market tools help you investigate the stock's price structure, buying and selling activity, options positioning, and the broader environment.
Where Is the Stock Trading?
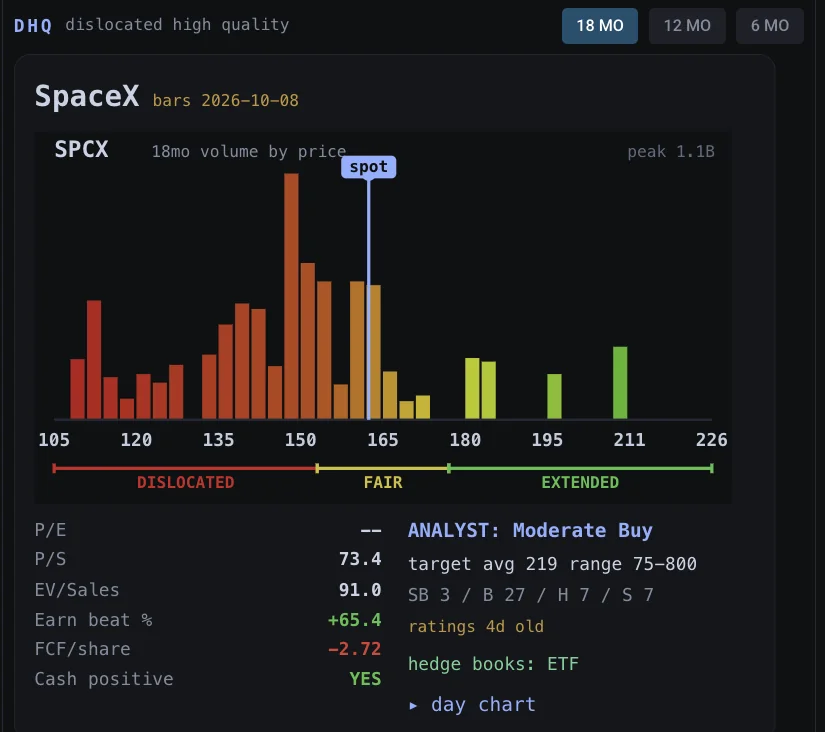
FlowDM's Dislocated High Quality board, or DHQ, shows where a supported company's stock sits within its 18-month historical price distribution. It divides that history into three ranges: dislocated, fair, and extended.
That context can help you evaluate potential opportunities. A lower historical price doesn't automatically mean a company is undervalued, but it can be a reason to investigate further.
Where Are Buyers and Sellers Concentrated?
Buying and selling activity helps explain price movement.
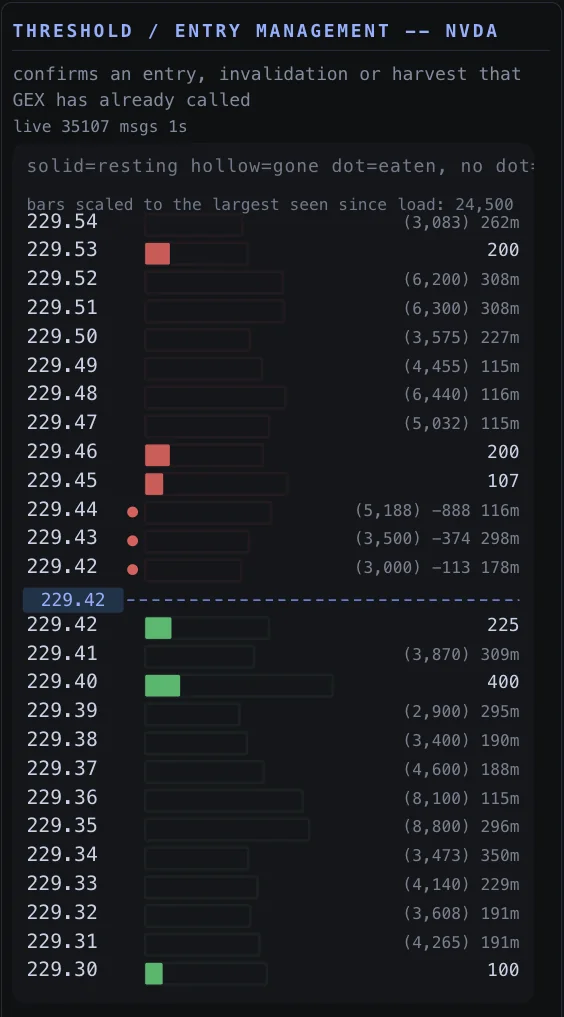
If a stock repeatedly declines toward an area and buyers absorb the selling there, that tested absorption shelf may matter when considering an entry, a protective threshold, or a hedge release.
FlowDM's on-demand Resting Book shows resting orders around the current price. It helps you examine where displayed buying and selling interest is concentrated and whether price behavior supports the presence of absorption.
A visible resting order alone is not proof of executed buying or selling. Orders can change or disappear; the evidence needs to be considered alongside how the stock behaves at that level.
What Are Options Dealers Doing?
Options are financial contracts that can influence how market makers and other professional participants buy and sell shares to manage risk.
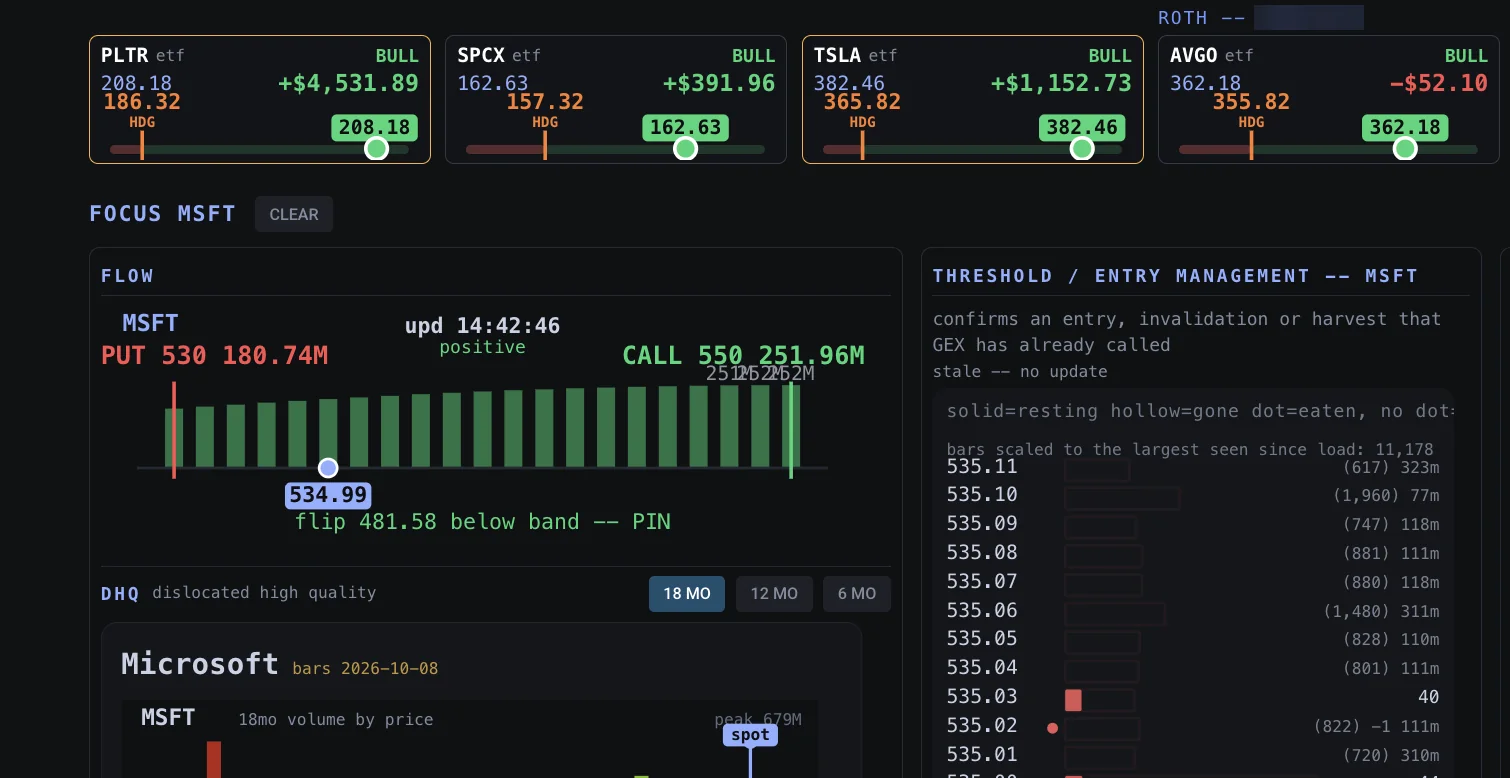
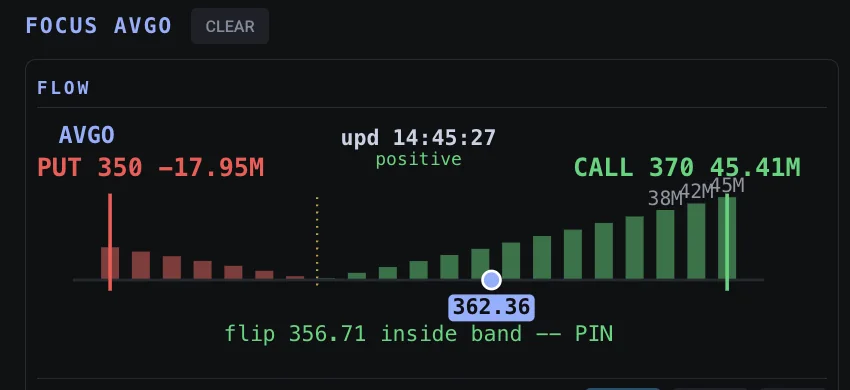
FlowDM's GEX Histogram provides options-positioning information, including call and put walls, estimates of dealer exposure, and the gamma flip.
Call and put walls identify price levels with concentrated open call- or put-option positions. The gamma flip marks where estimated net gamma crosses zero, helping you assess whether dealer hedging may dampen price moves or amplify them.
These are estimates based on options data. They do not reveal every dealer's actual holdings or guarantee that a level will hold.
The histogram refreshes throughout the session, so a wall can change. A newly drawn higher put wall is information to evaluate; it is not, by itself, a reason to raise your threshold before the higher band has tested and digested.
What's Happening in the Broader Market?
Even a strong company can struggle when the overall market is under pressure.
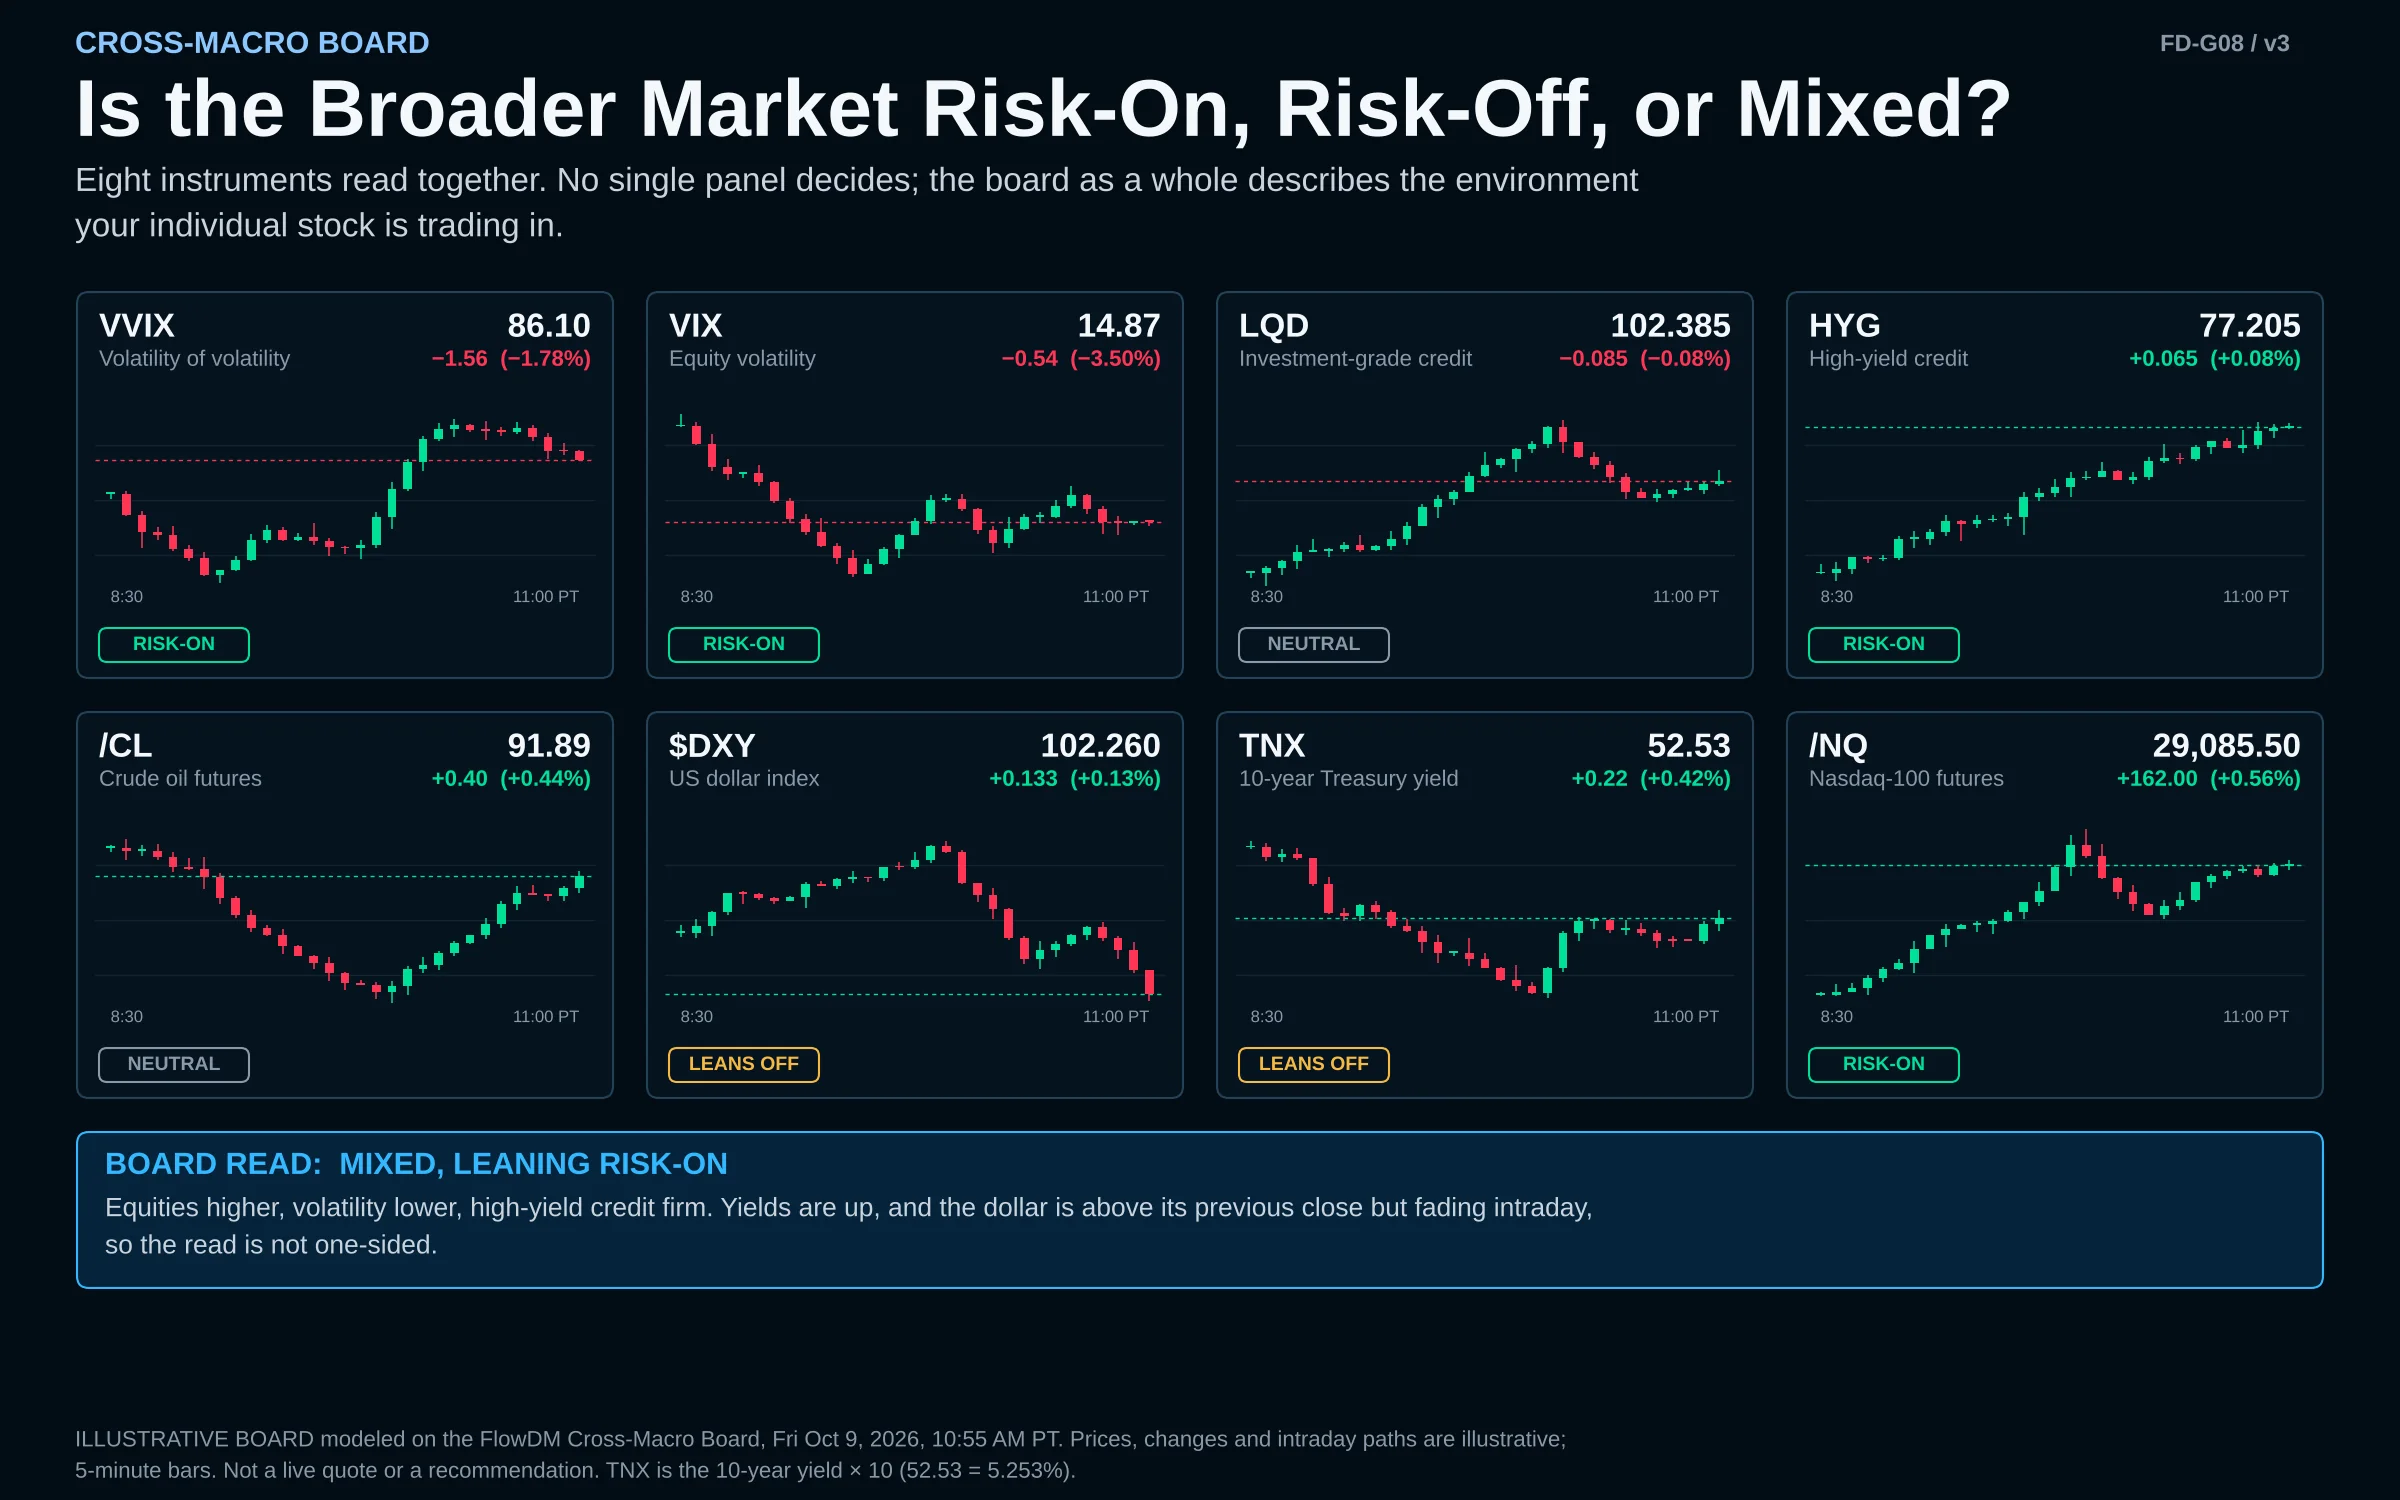
The Cross-Macro Board helps you check the market's overall weather before making decisions about an individual stock. It brings together:
- Volatility: Are investors becoming more fearful or more comfortable taking risk?
- Corporate credit: Are conditions becoming more supportive or more defensive for companies and investors?
- The U.S. dollar: Is currency strength or weakness adding pressure to financial markets?
- Treasury yields: Are changes in interest rates influencing stock valuations and investor behavior?
- Oil: Are energy prices signaling potential inflationary or economic pressures?
- /NQ Nasdaq-100 futures: How is the broader, technology-heavy equity market responding?
When several indicators point toward improving conditions, the environment may be described as risk-on. When they collectively suggest investors are becoming defensive, it may be risk-off. Sometimes the signals are mixed.
You don't evaluate a stock in isolation from the market surrounding it.
Putting the Information Together
No single indicator tells you everything.
A stock may look attractive based on its historical price while the Cross-Macro Board shows a deteriorating environment. An options level may appear supportive while selling overwhelms it. Options positioning may suggest one possibility while the stock behaves differently.
The value comes from examining those pieces of evidence together before making a decision.
The indicators serve the strategy. The strategy doesn't serve the indicators.