FlowDM

Course preview

FlowDM Foundations: Hedging & Market Structure

Learn what a hedge is, why you would use one, and how FlowDM reads market structure -- GEX, participation, the tape and position context -- to manage an active stock position as conditions change.

Contents

  1. Section 1 — From Market Insight to Position Management
    1. 1.1 — Sound Familiar?
    2. 1.2 — Okay… Now What?
    3. 1.3 — What Happens If the Stock Starts Climbing Again?
  2. Section 2 — How Does FlowDM Actually Do This?
    1. 2.1 — Now Let's See What That Looks Like Inside FlowDM
    2. 2.2 — Why These Stocks?
    3. 2.3 — One Position. Two Possible States.
    4. 2.4 — One Line. Two States.
    5. 2.5 — How Does Price Actually Move?
  3. Section 3 — Trading Structure, Not Narrative
    1. 3.1 — How Do We Identify the Price Levels That Actually Matter?
    2. 3.2 — GEX: Finding the Terrain
    3. 3.3 — RVOL: Is There Participation Behind the Move?
    4. 3.4 — Reading the Tape: What Is Actually Happening at the Price?
    5. 3.5 — DHQ: Where Is This Stock in Its Larger Journey?
    6. 3.6 — Threshold / Entry Management: What Is Happening Around the Price?
  4. Section 4 — Let's Review What We've Learned

Section 1 — From Market Insight to Position Management

FlowDM is an institutional-style hedge trading engine built for the individual trader. Rather than simply adding more indicators to your screen, FlowDM is designed to help you manage an active stock position as market conditions change.

But before we explain the engine, let's start with the idea at the center of it:

What is a hedge—and why would you use one?

Let's look at something almost every investor has experienced.

1.1 — Sound Familiar?

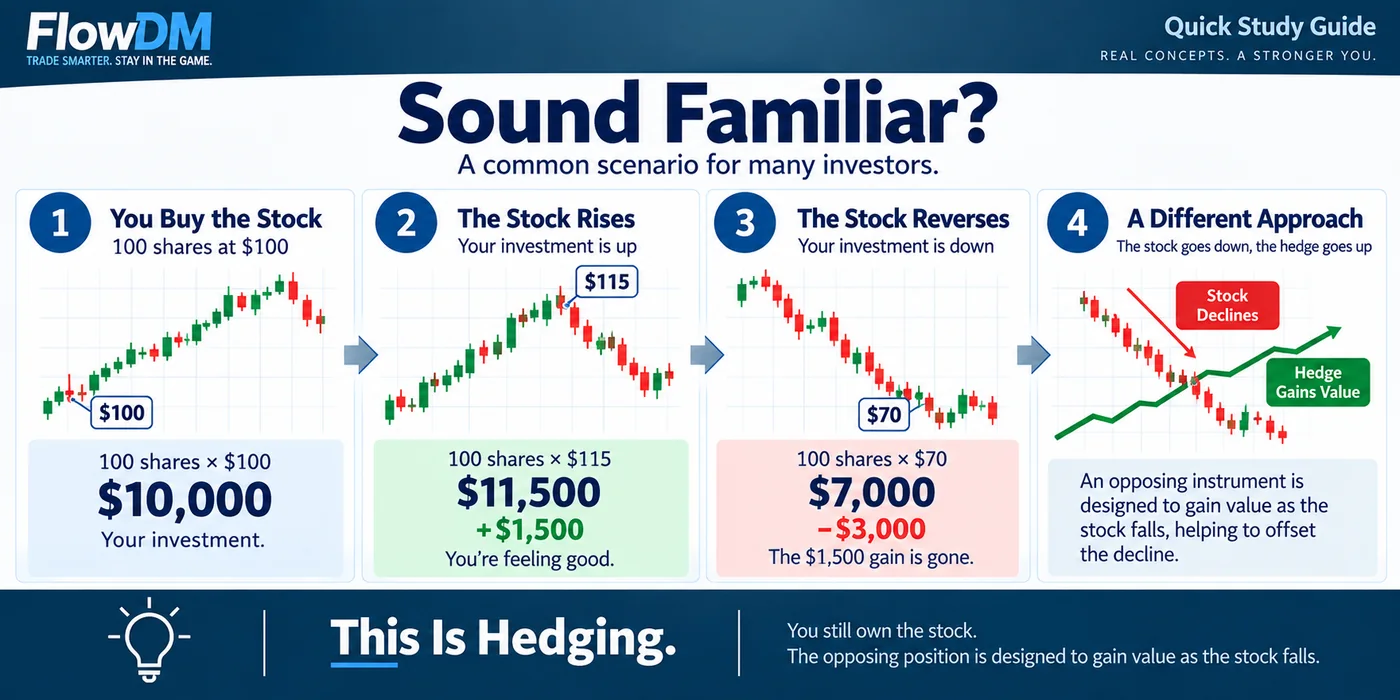
You find a company you like and buy 100 shares at $100 per share — a $10,000 investment.

Maybe you've researched the company and believe it's undervalued. Maybe the earnings story looks strong. Maybe analysts you follow are bullish on its future. Whatever brought you to the trade, you believe you've found a good company at a good price.

At first, you're right.

The stock climbs to $110… then $115.

Your original $10,000 investment is now worth $11,500. You're up $1,500.

Then something changes.

The stock reverses. $105 becomes $95. Then $85. Before long, the stock is trading at $70.

Your 100 shares are now worth $7,000.

The $1,500 gain is gone, and you're now sitting on a $3,000 loss from your original investment.

And the stock may stay there for weeks—or months.

If you've invested or swing traded for any length of time, you've probably experienced some version of this.

Traditionally, you're left with two choices:

Sell the stock, realize the $3,000 loss and move on.

Or:

Keep your 100 shares and wait, hoping the stock eventually recovers.

But What If There Were Another Choice?

What if the stock could fall to $70, but instead of your original investment being worth only $7,000, you had something else gaining value as the stock fell?

You would still own your 100 shares.

The stock would still be trading at $70.

But the value of the two investments together could remain much closer to where you started.

That's the basic idea behind hedging.
Section 1.1

1.2 — Okay… Now What?

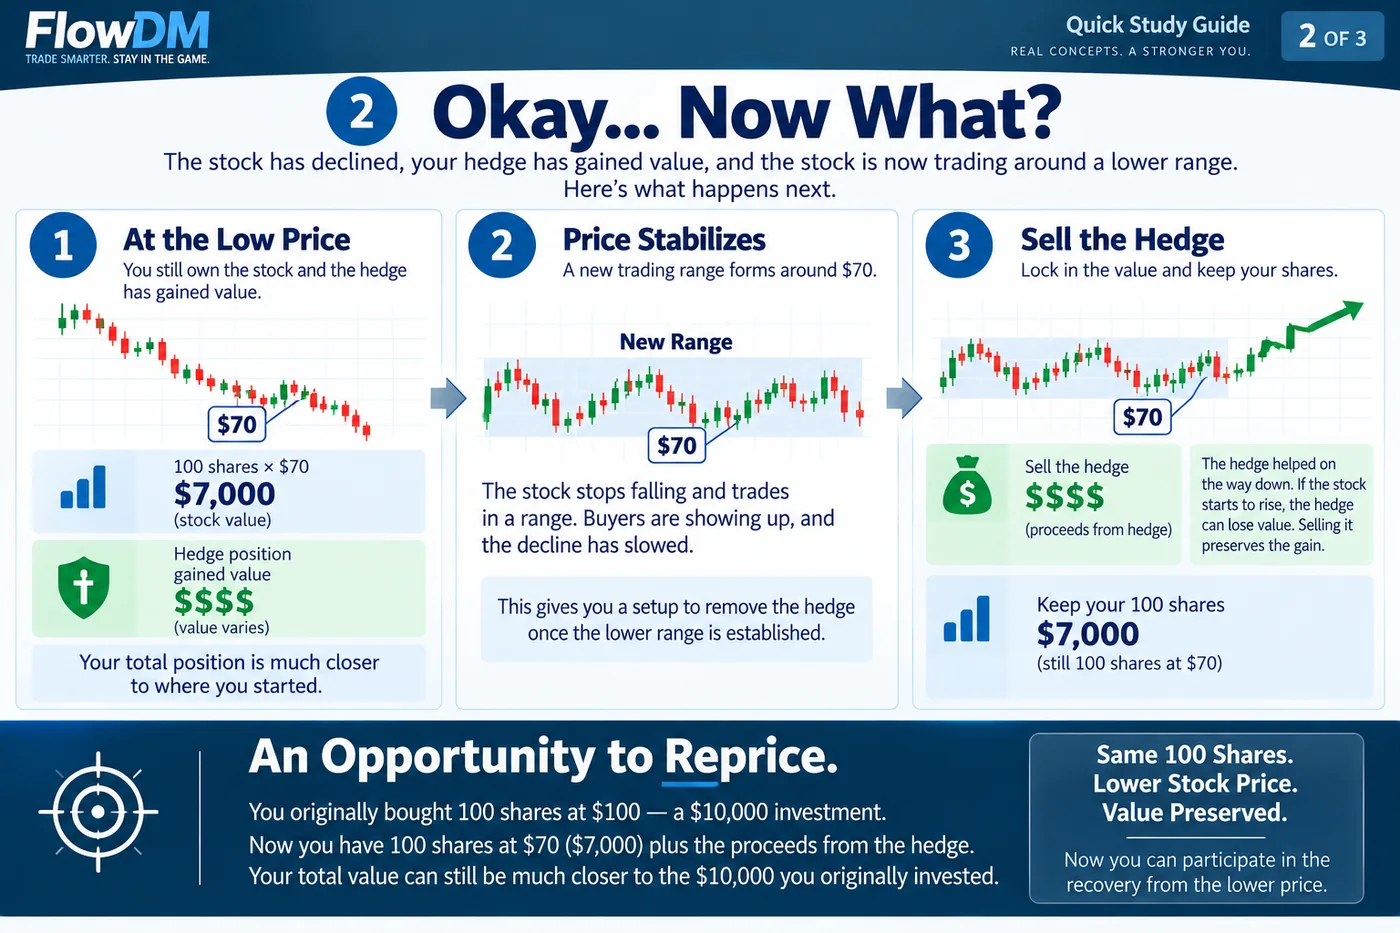
The stock is now trading around $70.

You still own your 100 shares, now worth $7,000. But you also own the hedge, which gained value as the stock declined.

So instead of looking at only a $7,000 stock position, you now have two instruments working together:

Your stock: $7,000

Your hedge: $$$$

Together, their value may be much closer to where you started.

But the story doesn't end there.

Eventually, the stock stops falling. Instead of continuing lower, it begins trading back and forth in the same general area. Buyers repeatedly appear, and a new trading range begins to establish around $70.

Now the purpose of the hedge changes.

Remember: the hedge gained value because the stock was falling. If the stock begins recovering and you continue holding the hedge, the opposite happens—the stock gains value while the hedge can begin losing value.

So once the trader determines that the decline has ended and the new lower range has established, the hedge can be sold.

You keep your original 100 shares.

And by selling the hedge, you lock in the value it gained during the decline and keep those proceeds.

Stock: $7,000

+ Hedge proceeds: $$$$

The stock is still trading around $70, but the value created by the hedge during the decline is no longer exposed to being given back if the stock begins to recover.

This Creates an Opportunity to Reprice the Position.

You originally bought 100 shares at $100 — a $10,000 investment.

Now the stock is trading around $70, so those same 100 shares are worth $7,000.

But you also have the $$$$ proceeds from selling the hedge.

Put the two together, and your total value can still be much closer to the $10,000 you originally invested — even though the stock itself is now priced around $70.

Think about what just happened:

You started with 100 shares at $100 and about $10,000 of value.

You now have 100 shares at $70 + $$$$ from the hedge — still much closer to that original value.

In effect, you've had the opportunity to reprice your original investment from $100 per share down toward $70 per share.

And now, if the stock begins climbing again, you're participating in that recovery from the lower price while keeping the value you captured from the hedge.

This is what is meant by repricing.
Section 1.2

1.3 — What Happens If the Stock Starts Climbing Again?

You still own your original 100 shares, and the stock is trading around $70 per share.

The hedge has been sold, and you have kept the $$$$ proceeds it generated during the decline.

Now the stock begins to recover.

$70 becomes $80.

$80 becomes $90.

Eventually, the stock returns to $100 per share.

Think about where the two investors are now.

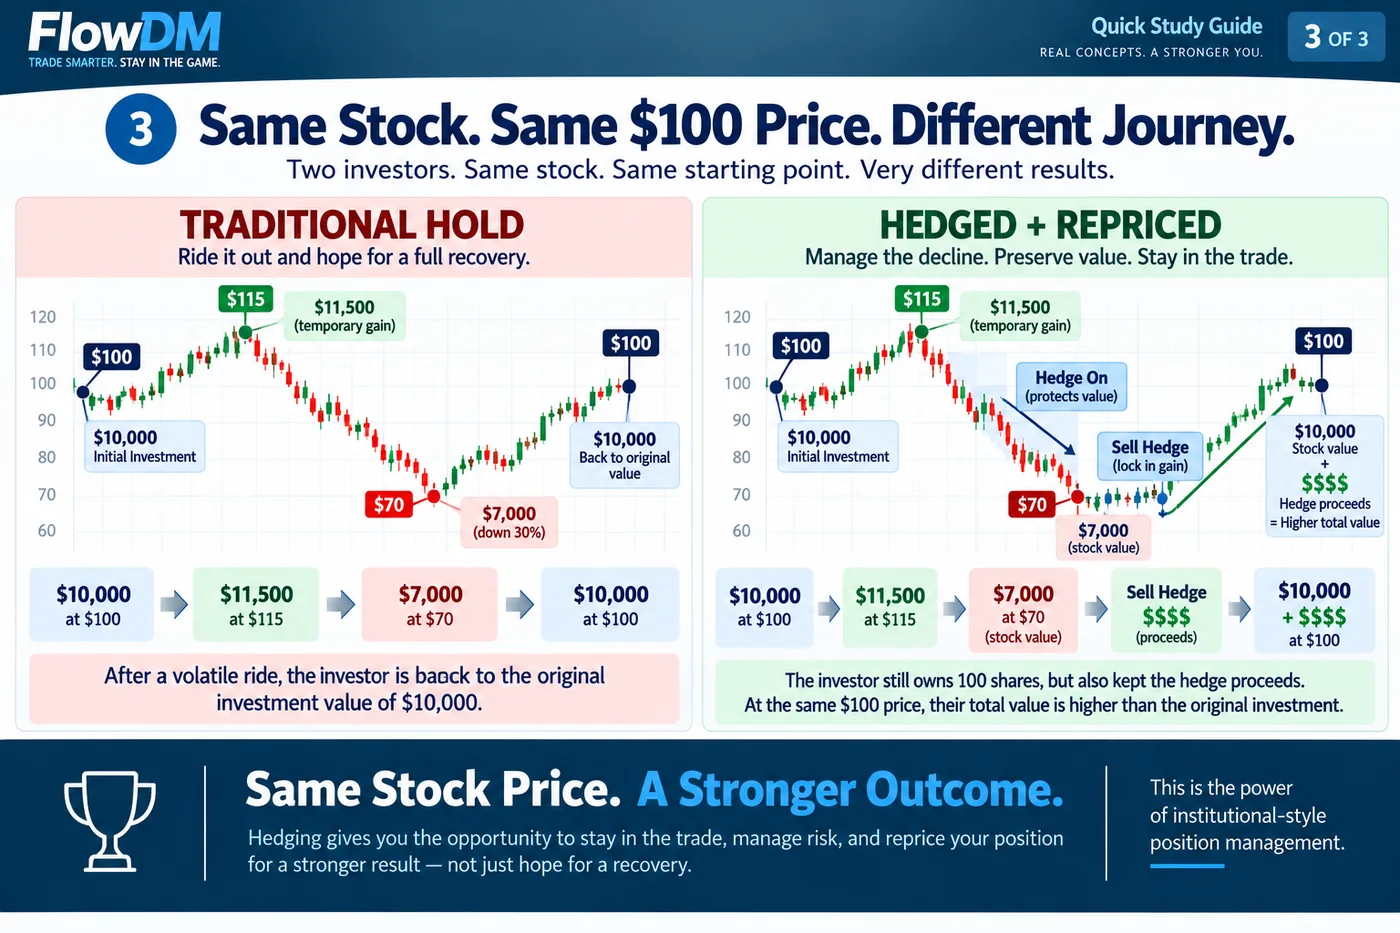
The investor who simply held the stock through the entire decline once again owns:

100 shares × $100 = $10,000

After watching the investment rise to $11,500, fall to $7,000 and eventually recover, that investor has finally returned to the original $10,000 investment value.

Now look at the investor who hedged the decline.

That investor also owns:

100 shares × $100 = $10,000

But there is an important difference.

The hedge was sold near the lower range, and the value it gained during the decline was preserved:

100 shares = $10,000

+ Hedge proceeds = $$$$

The stock has returned to the same $100 price, but the two journeys have produced very different results.

The first investor simply waited for the stock to return to the original purchase price.

The second investor reduced the impact of the decline, preserved value with the hedge, repriced the position at a lower level, and then participated as the stock recovered.

Same Stock. Same $100 Price. Different Journey.
Section 1.3

This is the fundamental idea behind FlowDM.

Rather than treating a stock position as something you simply buy, sell, or hold, FlowDM is designed around actively managing the exposure surrounding that position as market conditions change.

You can remain exposed to the stock when conditions are favorable, add an opposing hedge when conditions deteriorate, and remove that hedge when a new lower range has established—while continuing to own the original shares.

This Is Institutional-Style Position Management.

Institutions often think in terms of positions, exposure, inventory and risk, rather than treating every market move as a new buy-or-sell decision.

FlowDM brings that same style of thinking into a structured environment for the individual trader.

Stay in the position. Manage the exposure around it.

And that raises the next question:

How do you recognize when market conditions are actually changing?

Important Disclosures

Educational and Informational Purposes

FlowDM provides software tools, market information, analytical indicators, and educational resources intended to help self-directed traders and investors evaluate market conditions and manage investment exposure.

All information presented through the FlowDM website, educational courses, trading platform, and associated materials is provided for general informational and educational purposes only. Nothing presented constitutes individualized investment advice, a recommendation to purchase, sell, or hold any security, or a representation that a particular strategy is appropriate for any individual.

Investors are responsible for evaluating their own financial circumstances, investment objectives, risk tolerance, and experience before making investment decisions. Strategies discussed may not be suitable for every investor.

Investment Risk and Performance

All investing involves risk, including the potential loss of principal. Securities prices may fluctuate significantly, and investors may experience losses regardless of the quality of the underlying company or investment.

Past performance, historical market behavior, and hypothetical results do not guarantee future performance. No investment or hedging strategy can eliminate market risk or guarantee a profit.

Hedging and Position Management

FlowDM provides tools that allow users to establish and manage hedging thresholds for their positions. Its hedging methodology seeks to reduce directional market exposure through calibrated opposing positions, including inverse exchange-traded funds.

The objective of near-neutral exposure is a target, not a guarantee. Actual hedge effectiveness may differ because of market gaps, execution prices, bid-ask spreads, liquidity, tracking differences, timing, position sizing, and other market conditions.

Hedging may reduce losses during adverse price movements but may also reduce participation in subsequent market advances. A hedge may not fully offset losses in the underlying investment and may itself generate losses or additional costs.

Leveraged and Inverse Exchange-Traded Funds

FlowDM's hedging methodology may involve leveraged or inverse exchange-traded funds (ETFs). These products carry additional risks and may not be appropriate for all investors.

Many leveraged and inverse ETFs seek to achieve a stated multiple or inverse of an index's or security's daily performance. Their exposure generally resets daily, and returns over periods longer than one trading day can differ substantially from the stated daily objective, particularly during volatile or oscillating markets.

Compounding, tracking differences, financing expenses, fees, liquidity conditions, and market volatility may affect results. Investors should review the applicable ETF prospectus and understand the product's objectives and risks before trading.

Self-Directed Trading

FlowDM is designed for self-directed traders and investors. Users independently select their investments, determine position sizes, establish or modify hedge thresholds, and decide when to release hedges.

FlowDM may execute user-configured hedge actions automatically when specified conditions are met. Such automation operates according to the user's instructions and does not constitute discretionary portfolio management or individualized investment advice.

Users remain responsible for their trading decisions, account activity, and associated risks.

Market Indicators and Analytical Tools

FlowDM provides analytical information through tools including Gamma Exposure (GEX), the Dislocated High Quality (DHQ) board, the Resting Book, and the Cross-Macro Board.

These indicators reflect market data, calculations, estimates, or observed conditions. They are not predictions of future prices, guarantees of market direction, or assurances that a particular support or resistance level will hold.

No single technical indicator, market signal, or analytical tool should be relied upon as the sole basis for an investment decision. Market conditions can change rapidly, and information may become outdated.

AI Desk Analyst

FlowDM may allow users to submit market information to an external artificial intelligence model selected by the user for analytical interpretation.

AI-generated Desk Reads and related commentary are informational analyses, not personalized investment recommendations. AI systems can produce inaccurate, incomplete, outdated, or misleading conclusions.

Users should independently evaluate AI-generated information before making trading decisions. FlowDM does not guarantee the accuracy or reliability of third-party AI-generated content.

Hypothetical Examples and Illustrations

Unless expressly identified otherwise, charts, trade scenarios, performance comparisons, and educational illustrations are hypothetical, simplified, or provided solely to explain a concept.

Illustrative hedging examples may assume idealized execution or near-neutral offsets that may not occur in actual trading. Actual results depend on market conditions, product characteristics, execution, and other factors.

Unless otherwise stated, examples exclude commissions, transaction costs, spreads, financing expenses, taxes, and other potential charges.

Hypothetical results should not be interpreted as actual trading performance or as evidence that similar outcomes are achievable.

Market Data and Third-Party Information

Market prices, news, indicators, and other information displayed by FlowDM may originate from third-party data providers.

Such information may be delayed, incomplete, inaccurate, or subject to revision. Availability and update frequency may vary by source, market conditions, and service configuration.

FlowDM does not guarantee uninterrupted access to market data or the accuracy, completeness, or timeliness of third-party information.

Securities and Company References

References to individual companies, securities, ETFs, market indexes, or historical prices are provided for illustration, education, or explanation of FlowDM functionality.

Their inclusion does not constitute an endorsement or recommendation to buy, sell, or hold any investment.

Third-Party Trademarks

Company names, product names, ETF names, index names, symbols, and trademarks referenced in FlowDM materials remain the property of their respective owners.

References to third-party products or indexes do not imply sponsorship, affiliation, approval, or endorsement of FlowDM by their respective owners.

Important Reminder

FlowDM is a software platform designed to support informed, self-directed position management. It does not eliminate investment risk, guarantee hedge effectiveness, or assure favorable trading results.

Users should understand the instruments and strategies they employ and consider consulting appropriately qualified financial, tax, or legal professionals regarding their individual circumstances.